As the weeks of each season go by I like to record data to keep track of where we have been as far as volume, production and related events. Rather then manually righting information in a book this recorder does it for us as long as a new blank chart is inserted weekly. It also serves as a tool to predict what the outcome of the day based on past trends.
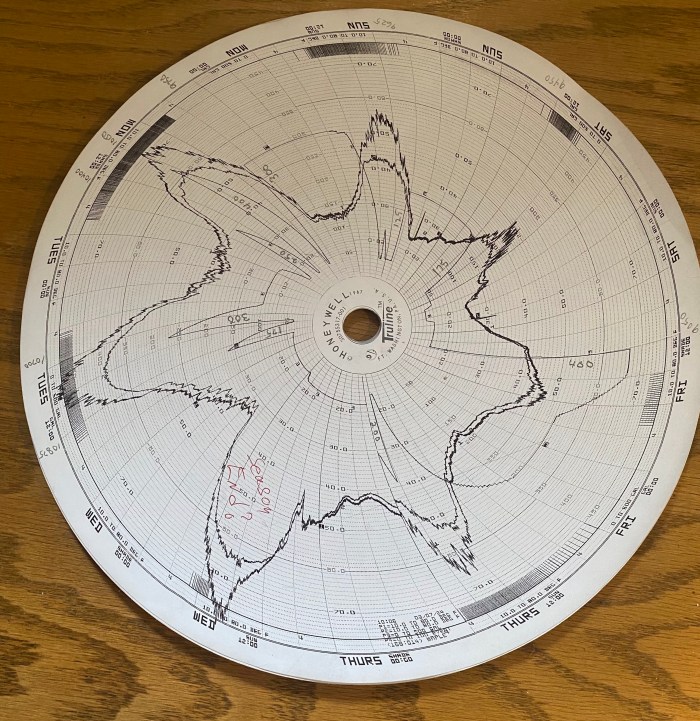
Below is a “Honeywell Tru-Line circular chart recorder data sheet”. It records for 7 days at a time. The minor divisions are 3 hours and major divisions are 12 hours. There are 4 points of data collected here. The scales are set for 10 to 80 deg.F, and 0 to 500 gal. In the future I would like to add another sensor to keep track of the vacuum level goin to the trees also.
Pen 1: Sunny temperature (jagged line outside most).
Pen 2: Shade temperature (jagged line under sunny line).
Pen 3: Collection building tank level in gallons (smooth line beginning near center).
Event Pen: Frequency of vacuum release cycles in the collection building (short lines on the outside circle).